Churn Rate Meaning: Definition, Formula & How to Fix It
Churn rate is the percentage of customers, or the percentage of recurring revenue, that a business loses over a specific period of time. It is arguably the single most honest number in any subscription or retainer-based business, because it strips away vanity metrics and shows exactly how much of what you built last quarter is still standing today.
Whether you run a SaaS platform, a retainer-based agency, a consultancy, or a subscription box company, the logic is the same: revenue you already won is far cheaper to keep than new revenue is to chase. Consequently, businesses that watch this metric closely tend to grow faster while spending less on acquisition. This guide goes further than most explanations online — it covers the exact formula, every major variant of the metric, industry benchmarks, root causes, and a concrete action plan for lowering it, so you leave with everything you need and nothing left to search for.
What Is Churn Rate? A Clear, Practical Definition
In plain terms, churn rate is a retention metric that measures attrition — the rate at which customers or recurring revenue disappear — over a defined window of time. Rather than celebrating new sales, it looks backward and asks one blunt question: of everything you had at the start, how much is gone by the end? Specifically, the metric shows up in two primary forms:
- Customer churn rate — the percentage of accounts, subscribers, or clients who cancel or stop buying.
- Revenue churn rate — the percentage of recurring revenue lost, including downgrades and partial cancellations.
Direct answer: Churn rate is the percentage of customers or revenue a business loses within a chosen time period, calculated by dividing the number lost by the number at the start, then multiplying by 100. A lower churn rate means the business is retaining more of the revenue it has already earned — and a rising churn rate is often the earliest warning sign of trouble ahead.
According to Wikipedia's churn rate entry, the metric is most meaningful when measured over a consistent interval, since comparing a monthly figure to an annual one produces misleading conclusions. For that reason, most finance and client success teams standardize on monthly or annual reporting and never mix the two in the same dashboard. Similarly, Investopedia's definition of churn rate notes that the metric applies broadly across telecom, banking, SaaS, and subscription retail — any business model where customers can leave without a one-time, final purchase.
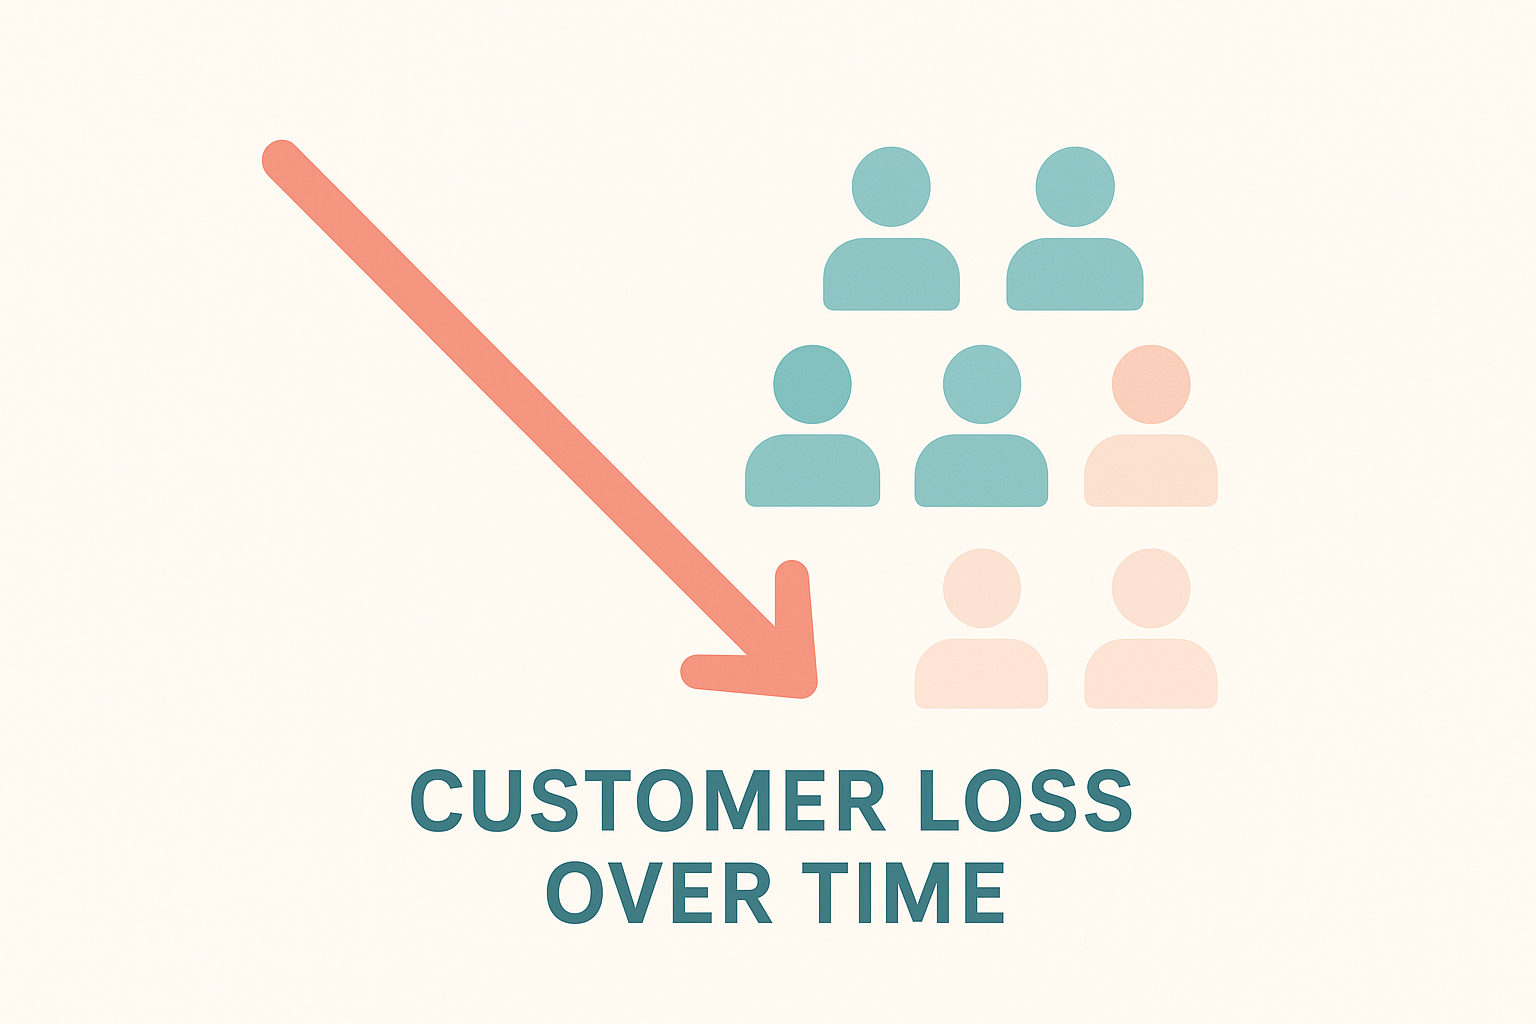
A visual representation of churn rate: the share of customers or revenue lost over a defined reporting period.
The Churn Rate Formula: How to Calculate It Step by Step
Calculating churn rate is straightforward once the formula is clear. The basic equation, used for customer churn, looks like this:
Churn Rate (%) = (Customers Lost ÷ Customers at Start of Period) × 100
For example, imagine an agency that started the month with 120 retained clients and lost 6 of them. Dividing 6 by 120 and multiplying by 100 gives a monthly churn rate of exactly 5 percent. Revenue churn uses the same logic but swaps customer counts for dollars: if that same agency started the month with $240,000 in recurring revenue and lost $9,600 of it to cancellations and downgrades, its revenue churn rate would be 4 percent. Follow this process to calculate either figure accurately every time:
- Choose a consistent time period, such as monthly, quarterly, or annually, and commit to using that same window for every future report so comparisons remain valid over time.
- Count the total number of active customers, or the total recurring revenue, at the very start of that period, before any cancellations or downgrades have occurred.
- Count how many of those customers canceled, downgraded substantially, or stopped paying before the period ended, while excluding any new customers signed during that same window.
- Divide the number lost by the number you started with, then multiply the result by 100 to produce a percentage figure you can track and compare over successive periods.
Doing this math by hand every month gets tedious, especially once you need to track revenue churn and customer churn side by side. Tools like the free churn calculator automate it instantly, and ClientBloom's own step-by-step churn calculation guide walks through additional worked examples, including cohort-based calculations for businesses with staggered contract start dates.
Customer Churn Rate vs. Revenue Churn Rate
These two figures often tell different stories, so relying on only one can hide real risk. Customer churn counts how many accounts left, regardless of size, while revenue churn weighs each departure by dollar value. As a result, a business could lose ten small accounts and barely dent revenue churn, yet lose a single enterprise client and see revenue churn spike dramatically. For a deeper breakdown with real numbers, see this customer churn rate calculation walkthrough.
Gross Churn, Net Revenue Churn, and Logo Churn
Not all churn behaves the same way, so it helps to separate the variants rather than collapse everything into one average.
- Gross churn rate: total revenue or customers lost, with no offsetting gains factored in.
- Net revenue churn: revenue lost minus expansion revenue from existing customers, which can go negative when upgrades outpace losses.
- Logo churn: the raw count of accounts lost, irrespective of their contract size.
As an illustration, a consultancy might lose three small retainers but gain two large expansions in the same month, producing negative net revenue churn even though logo churn technically increased. Therefore, tracking more than one version of the metric prevents a misleadingly rosy or bleak picture.
What Is a Good Churn Rate? Benchmarks by Industry
A good churn rate depends heavily on contract length, deal size, and industry, so there is no single universal target. That said, the following ranges reflect widely cited benchmarks across common recurring-revenue models:
- Enterprise SaaS: typically 5 to 7 percent annual customer churn, thanks to longer contracts and higher switching costs.
- SMB-focused SaaS: often 10 to 15 percent annually, since smaller buyers churn more easily and have shorter commitment cycles.
- Agencies, consultancies, and fractional firms: generally aim for under 10 to 15 percent annual churn given month-to-month or quarterly retainer flexibility.
- Subscription retail and e-commerce: can range from 20 to 40 percent annually due to low switching friction and price sensitivity.
- Telecom and media streaming: frequently sees some of the highest churn, occasionally exceeding 20 percent annually in highly competitive markets.
Businesses with month-to-month agreements often tolerate higher monthly figures simply because clients have more frequent opportunities to leave. Ultimately, the right benchmark is the one you set for your own business and then work to beat each quarter. The ClientBloom retention platform lets teams set custom benchmarks tied to their specific client mix, contract length, and account size rather than relying on a generic industry average.
Why Churn Rate Matters More Than You Think
For agencies, SaaS companies, and subscription brands alike, recurring revenue is the backbone of the business model. As a result, even a small increase in churn can erase months of new-business effort almost overnight. Research popularized by Bain & Company and discussed in Harvard Business Review's analysis of customer retention economics has long suggested that increasing retention by just 5 percent can lift profits by 25 percent or more, depending on the industry.
In addition, churn is a leading indicator rather than a lagging one. Unlike revenue reports that confirm what already happened, a rising churn rate often signals trouble months before it shows up on a profit-and-loss statement. This is precisely why continuous monitoring, rather than quarterly reviews alone, tends to catch problems while they are still fixable.
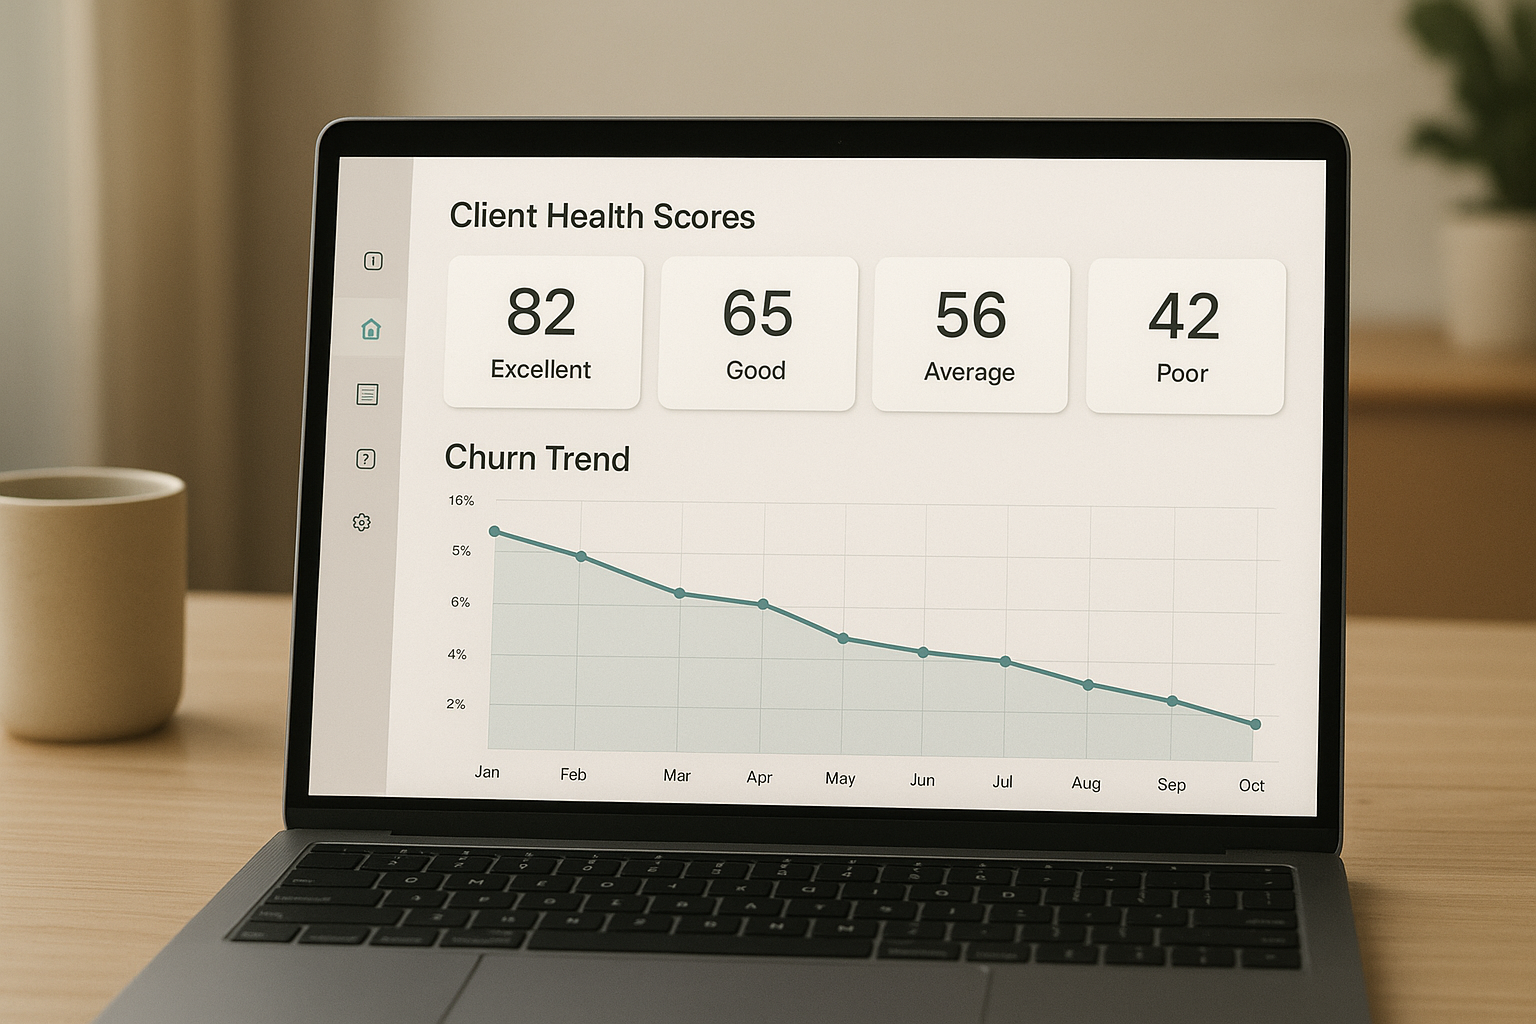
Continuous client health scoring helps teams spot churn risk before a contract ends.
The Real Cost of a High Churn Rate
Churn costs include lost recurring revenue plus the sales and onboarding expense required to replace that customer. Figures widely cited across industry reports suggest acquiring a new customer can cost five to seven times more than retaining an existing one. In contrast, reducing churn compounds in the opposite direction: every client you keep this year is a client who can expand, refer, and generate margin next year without any additional acquisition spend.
What Causes a High Churn Rate?
High churn rarely has a single cause. Instead, it usually results from a combination of the following issues compounding over time:
- Poor onboarding: customers who never reach their first meaningful result are far more likely to leave within the first 90 days.
- Inconsistent communication: clients who hear from you only when invoices are due feel undervalued and disengaged.
- Unmet expectations: a mismatch between what was sold and what was delivered erodes trust quickly.
- Slow or weak support experiences: delayed responses and unresolved issues push customers toward competitors, even when the core product is solid.
- No visibility into client health: without early warning signals, teams often learn about dissatisfaction only after a client has already decided to leave.
Notice how support quality and communication consistency show up repeatedly. Above all, a strong customer experience is the single most controllable lever a business has over its churn rate — far more controllable than market conditions or competitor pricing.
How to Reduce Churn Rate: A Proven Playbook
Lowering churn starts with visibility. Specifically, teams need a reliable way to see which clients are at risk before a cancellation notice ever arrives. The following tactics, in order of impact, form a repeatable playbook rather than a one-time fix:
- Standardize onboarding during the first 30 days so every new customer reaches a clear, early win.
- Score client health continuously using engagement, sentiment, and billing data instead of relying on gut feel.
- Build escalation protocols so at-risk accounts get a human response within hours, not weeks.
- Run structured check-ins, including pulse surveys and quarterly business reviews, to surface friction before it festers.
- Respond fast and personally to support requests, since response speed and tone directly influence whether a frustrated client stays or leaves.
In practice, consistency beats heroics; a repeatable playbook outperforms reactive, case-by-case saves. For a complete tactical breakdown, the how-to-reduce-client-churn guide walks through specific interventions step by step, while the Client Retention Score guide explains how continuous health scoring works in more detail. If you want the full strategic picture from first principles, ClientBloom's complete guide to tracking and cutting customer loss is the most thorough resource on the topic.
Churn Rate vs. Retention Rate: What's the Difference?
Churn rate and retention rate are mirror metrics. Retention rate measures the percentage of customers kept, while churn rate measures the percentage lost. For example, a 90 percent retention rate corresponds exactly to a 10 percent churn rate — the same underlying data, viewed from opposite directions. Neither number is inherently more useful; however, churn tends to draw more attention from leadership because it highlights the problem rather than the status quo.
Common Mistakes When Measuring Churn Rate
Many teams unintentionally miscalculate churn, which can hide a real problem behind a flattering number. For instance, blending customer churn with revenue churn into a single figure often masks the fact that a business is losing its largest accounts while retaining many small ones. Similarly, switching time periods between reports, such as comparing one month to a different quarter, makes trend analysis unreliable. Finally, ignoring partial downgrades, where a client stays but reduces spend, understates the true revenue impact of churn and can leave leadership unaware of a slow bleed.
How ClientBloom Helps Teams Track and Reduce Churn Rate
ClientBloom is built specifically for established service businesses where retention drives recurring revenue, such as retainer-based agencies, consultancies, coaching practices, and fractional executive firms. Rather than replacing a CRM, the platform connects to tools teams already use, including CRM, billing, meeting, and call transcript data, to score the health of every client relationship daily.
Each morning, the Business Intelligence Agent delivers a brief to Slack, email, text, or Telegram, flagging who to call, why, and what to do next — turning churn rate from a lagging report into a daily, actionable signal. For teams comparing retention platforms, the ClientBloom vs ChurnZero comparison and the silent churn solution page outline how continuous scoring differs from periodic reviews alone.

Daily briefs help account teams act before churn risk turns into a lost client.
Frequently Asked Questions About Churn Rate
What is churn rate?
Churn rate is the percentage of customers or revenue a business loses during a given period. It tells you how much of your client base or recurring revenue walked away instead of staying, making it one of the clearest health checks a recurring-revenue business can run.
How do you calculate churn rate?
You divide the number of customers lost during a period by the number of customers you started with, then multiply by 100. For example, losing 5 of 100 clients in a month equals a 5 percent monthly churn rate.
What is the difference between customer churn rate and revenue churn rate?
Customer churn rate counts how many accounts leave, while revenue churn rate measures how much recurring revenue is lost, including downgrades. A business can lose a small number of accounts yet still suffer high revenue churn if those accounts were large.
What is a good churn rate for a business?
Most established service businesses aim for an annual churn rate below 10 to 15 percent, though benchmarks vary widely by industry and contract length. Enterprise SaaS often sees 5 to 7 percent, while subscription retail can run considerably higher.
How often should a business measure churn rate?
Monthly tracking is standard for most service businesses, with a rolling annual view used for benchmarking. Reviewing churn more frequently, such as weekly, helps catch at-risk clients before they actually cancel.
What causes a high churn rate?
High churn is usually caused by poor onboarding, inconsistent communication, unmet expectations, weak support experiences, or a lack of visibility into client health. Without early warning signals, teams often learn about dissatisfaction only after a client has already decided to leave.
What is the difference between churn rate and retention rate?
Churn rate and retention rate are mirror metrics: retention rate measures the percentage of customers kept, while churn rate measures the percentage lost. A 90 percent retention rate corresponds to a 10 percent churn rate.
How much does a high churn rate cost a business?
Churn costs include lost recurring revenue plus the sales and onboarding expense needed to replace that client. Research widely cited in industry reports suggests acquiring a new customer can cost five to seven times more than retaining an existing one.
What are the most common churn rate calculation mistakes?
Common mistakes include mixing customer churn with revenue churn, using inconsistent time periods between reports, and ignoring downgrades that reduce revenue without a full cancellation. These errors can make a churn problem look smaller than it really is.
How can a business reduce its churn rate?
Businesses reduce churn rate by monitoring client health continuously, intervening early at the first sign of risk, standardizing onboarding, and responding quickly to support requests. Structured playbooks for at-risk accounts consistently outperform reactive, case-by-case responses.
What is negative churn?
Negative churn happens when expansion revenue from existing clients, such as upsells, exceeds the revenue lost from cancellations and downgrades. It means a business can grow recurring revenue even while losing some accounts.
Does a good churn rate vary by industry?
Yes, acceptable churn varies widely. Subscription software often tolerates different benchmarks than retainer-based agencies, telecom carriers, or subscription retail brands. Contract length, switching costs, and client concentration all influence what counts as a healthy rate for a given industry.
Key Takeaways on Churn Rate
In summary, churn rate comes down to one idea: it measures how much of your customer base or revenue you lose over time, and lowering it protects revenue you have already earned. Because churn is a leading indicator of future financial trouble, measuring it consistently and acting early on at-risk accounts matters far more than reacting after a cancellation notice arrives.
Whether a business tracks churn manually or through a dedicated platform such as ClientBloom, the goal remains the same: understand the number, watch it closely, and build a repeatable process to keep more of the revenue already won.