
Churn Rate Business Guide: Track & Cut Customer Loss
A churn rate business metric reveals the one number many leadership teams ignore until it is too late: how many clients you are losing every period, and what that quiet drain is really costing you in revenue and referrals. For agencies, consultancies, and any company that runs on recurring retainers, this figure often forecasts next quarter's revenue more accurately than the sales pipeline does. Below, you will find the exact churn rate business formula, realistic benchmarks by industry, the true causes behind lost clients, and a complete action plan for cutting churn — covering more ground than any single guide you have read on this topic.
A churn rate business metric is the percentage of customers or revenue a company loses during a set period, found by dividing lost customers by the customers you started with, then multiplying by 100. Most established service businesses aim to keep annual churn under 10%, which equals roughly 1% or less per month.
Because churn compounds quietly, a business can look healthy on a monthly P&L while steadily losing its base of long-term, recurring clients. In addition, churn is cheaper to prevent than to fix, since replacing a lost client typically costs far more than retaining one.
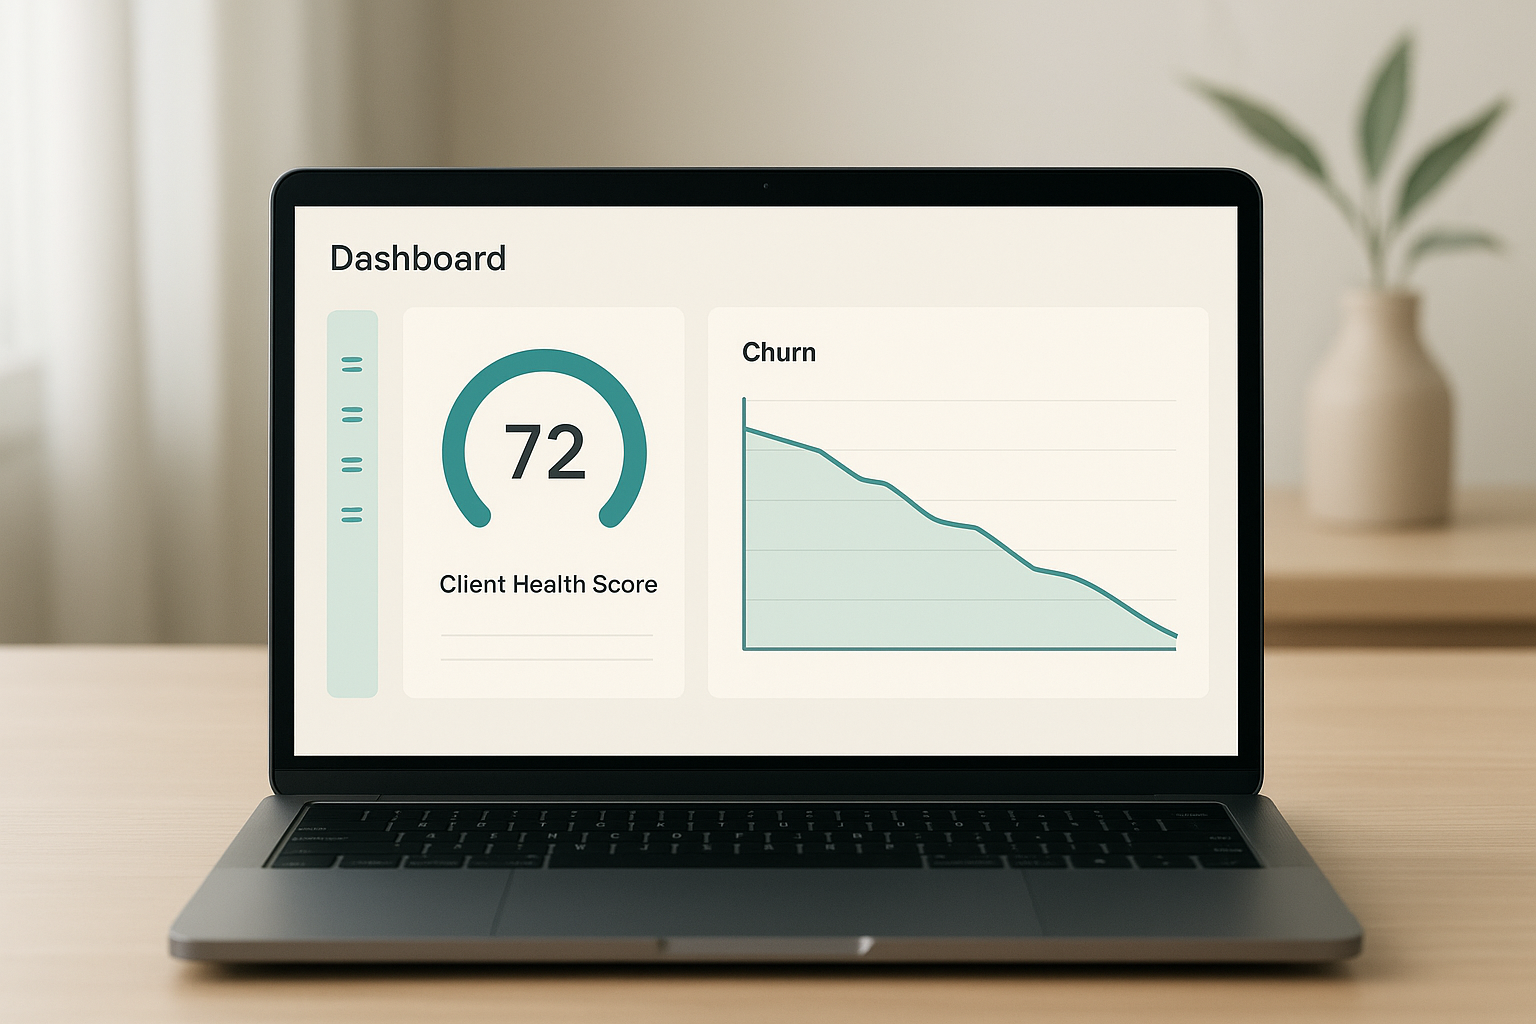
Monitoring churn rate business metrics daily helps teams catch at-risk clients before they cancel.
What Is a Churn Rate for a Business?
A churn rate for a business is the share of customers, or the share of revenue, that a company loses within a defined period. Specifically, it measures attrition rather than growth, which makes it one of the clearest signals of relationship health a service company can track.
According to Wikipedia's overview of customer attrition, churn has been studied across telecom, subscription, and professional services industries for decades because it directly predicts long-term revenue stability. Similarly, Investopedia's explainer on churn rate notes that even small percentage changes in churn can produce outsized effects on lifetime customer value.
Customer Churn vs. Revenue Churn, and Gross vs. Net Churn
Not all churn numbers measure the same thing, and mixing them up is one of the fastest ways to misread your churn rate business trend. Customer churn counts how many accounts you lost, while revenue churn counts how many dollars left with them. In particular, a business can lose five small clients worth little revenue, or lose one large account that quietly guts the budget, and customer churn alone would treat both events as equally significant.
Gross churn measures total revenue lost from cancellations and downgrades, full stop. Net churn, in contrast, subtracts any expansion revenue — such as upsells or added seats — from that same loss. As a result, a business can show 8% gross churn but only 2% net churn if existing clients are spending more even as a few leave. According to Corporate Finance Institute's breakdown of churn rate calculations, net revenue churn is generally considered the more reliable long-term indicator because it reflects the full relationship between retention and growth.
For a side-by-side walkthrough of every formula variation, including worked examples for each type, see this deep dive on churn rate meaning, definition, and formula.
Why Tracking Customer Churn Matters for Service Businesses
For agencies and consultancies running on retainers, customer churn is not just a metric to report; it is the clearest leading indicator of recurring revenue health you have. Therefore, a rising churn trend typically shows up in the data weeks before it shows up as a cancellation email.
Research popularized by Bain & Company, and widely cited in Harvard Business Review, found that increasing customer retention by just 5% can increase profits by 25% to 95%, depending on the industry. Consequently, even modest improvements in retention frequently outperform new sales efforts when it comes to total profit impact.
Service businesses that depend on referrals feel churn twice over: once in lost recurring revenue, and again in lost word-of-mouth growth that never materializes. In short, treating churn as a strategic metric rather than a reporting afterthought tends to separate businesses that scale from those that quietly plateau.

Regular reviews of retention trends keep teams aligned on where churn risk is building.
How to Calculate Your Churn Rate Business Formula, Step by Step
Calculating churn does not require specialized software, though automation helps considerably once your client portfolio grows. Below is the standard process used across most service industries, and it works whether you track clients, seats, or revenue.
- Pick a measurement period. Choose monthly, quarterly, or annual tracking, and stay consistent so trends remain comparable from one period to the next.
- Count starting customers. Record exactly how many active clients you had at the very beginning of that period, before any additions or losses.
- Count customers lost. Tally cancellations or non-renewals among those starting clients specifically, excluding brand-new accounts signed mid-period.
- Divide and multiply by 100. Divide the number of lost customers by your starting customer count, then multiply by 100 to express the result as a percentage.
- Track the trend over time. Log the result every period in a dashboard or spreadsheet so spikes and improvements become visible early, not months later.
For example, a consultancy with 80 active retainers that loses 4 clients in a month has a 5% monthly churn rate. If that pattern continues unchecked, however, the same business would lose nearly half its client base within a year — which is exactly why monthly tracking matters more than a single annual snapshot. Businesses that want a faster starting point can run their own numbers through a free churn rate calculator instead of building a spreadsheet from scratch, or work through additional worked examples in this complete churn calculation guide.
Monthly vs. Annual Churn Rate: Converting Between the Two
A common mistake is assuming you can simply multiply monthly churn by twelve to get an annual figure, but that overstates the real number. Because churn compounds against a shrinking base each month, the accurate conversion formula is: Annual Churn = 1 − (1 − Monthly Churn)^12.
For instance, a business with 2% monthly churn does not lose 24% of clients annually; it actually loses closer to 22%, since each month's losses come from an already-smaller base. In contrast, if you only measure annually, you can miss three or four months of early warning signs that a monthly view would have caught immediately. Above all, service businesses with seasonal retainers should track both figures side by side rather than relying on just one.
How Your Churn Rate Business Metric Affects Customer Lifetime Value
Churn and customer lifetime value, or CLV (the total revenue you can expect from one client across the entire relationship), are directly linked by a simple formula: CLV = (Average Revenue Per Client × Gross Margin) ÷ Churn Rate. Specifically, as your churn rate falls, the denominator shrinks, and projected lifetime value rises sharply, even if nothing else about the business changes.
For example, dropping churn from 10% to 5% effectively doubles projected CLV for an otherwise identical client, according to the methodology outlined by Harvard Business School Online's guide to calculating customer lifetime value. As a result, churn reduction frequently delivers a better return than acquiring new clients, since it compounds across every existing account. Similarly, lower churn improves your ratio of lifetime value to acquisition cost — a figure investors and lenders scrutinize closely.
What Counts as a Healthy Churn Rate Business Benchmark?
A healthy churn rate business benchmark for most established service companies sits below 10% annually, which works out to under 1% monthly. Above all, context matters: an agency with 20 large retainer clients tolerates churn very differently than one serving 200 smaller accounts, since each lost client represents a bigger share of total revenue.
Industry data generally places strong-performing B2B SaaS churn between 5% and 7% annually, while professional services and agencies often run slightly higher because of project-based engagements that naturally end. In contrast, fractional executive and coaching businesses with long-term relationships often report the lowest churn when onboarding and regular check-ins are structured well.
| Business Type | Typical Annual Churn |
|---|---|
| B2B SaaS (strong performers) | 5–7% |
| Overall SaaS industry average (all sizes) | 10–15% |
| Marketing & consulting agencies | 8–15% |
| Coaching & fractional executive services | 5–10% |
| E-commerce subscription services | 10–15% |
Common Causes of Client Churn in Service Businesses
Most client churn traces back to a handful of recurring causes rather than random bad luck. For instance, unclear communication about results often drives cancellations even when the underlying work is genuinely good.
Other frequent causes include weak onboarding in the first 30 days, declining meeting attendance, missed renewal conversations, and a lack of proactive check-ins before problems escalate. Furthermore, businesses that only talk to clients during renewal season usually discover issues long after the window to fix them has closed.
Voluntary vs. Involuntary Churn
Voluntary churn happens when a client actively decides to leave, usually over price, results, or fit. Involuntary churn, meanwhile, happens for reasons unrelated to satisfaction, such as a failed payment, a client's own business closing, or a point of contact leaving the company. Because the fixes differ completely, lumping both types into a single churn number can hide which problem you actually need to solve.
How to Reduce Churn and Protect Recurring Revenue
Reducing churn starts with visibility: a business cannot fix what it cannot see early. Specifically, mapping the first 30 days of a client relationship and tracking onboarding milestones tends to catch problems well before they turn into cancellations.
In addition, structured pulse checks and quarterly business reviews give clients a regular channel to raise concerns before frustration builds silently. Teams that pair this with a defined escalation protocol for at-risk accounts generally recover more relationships than those relying on informal, ad-hoc check-ins. A detailed walkthrough of this approach is available in this guide to reducing client churn.
Churn exit surveys matter too, because they turn a lost client into usable data instead of a dead end. Likewise, a short win-back campaign sent 30 to 60 days after cancellation occasionally recovers accounts that left over a temporary, fixable issue rather than a permanent one. Finally, compensating customer success managers partly on retention, rather than only on new sales, tends to align incentives with long-term client health. Businesses facing quieter, harder-to-spot attrition should also review this resource on stopping silent client churn before it shows up in the numbers.
Negative Churn: When Expansion Revenue Outpaces Loss
Negative revenue churn sounds like a contradiction, but it describes a genuinely good outcome: expansion revenue from existing clients, such as upsells, added services, or seat growth, exceeds the revenue lost from cancellations during the same period. In this scenario, your revenue grows even if your total client count shrinks slightly.
Negative churn is rare but achievable for service businesses that build tiered offerings or ongoing upsell paths into their delivery model. Consequently, it is considered one of the strongest possible signals of a healthy, growing client base, since it proves that the clients who stay are becoming more valuable over time, not just more numerous.
Tools That Help Lower Business Churn Rate
Spreadsheets work for a handful of accounts, but they struggle once a portfolio grows past a few dozen clients. As a result, many service businesses adopt dedicated retention platforms that pull signals from a CRM, billing system, and meeting transcripts automatically, rather than relying on someone remembering to update a tab.
ClientBloom, for example, is built specifically for established service businesses that already have a CRM in place; it connects through read-only integrations and does not require replacing any existing tool. The platform scores every client relationship from 0 to 10 daily and sends a morning brief to Slack, email, text, or Telegram showing who to call and why. Businesses evaluating options can see how this approach compares to other platforms in this ClientBloom vs. ChurnZero comparison, and can browse more tactical resources in the full retention guides library.
Frequently Asked Questions About Churn Rate Business Metrics
What is churn rate in business?
Churn rate in business is the percentage of customers or revenue a company loses during a set period, usually a month, quarter, or year. It is the inverse of your retention rate and signals how well you keep the clients you already won.
How do you calculate churn rate for a business?
Divide the number of customers lost during a period by the number of customers you had at the start of that period, then multiply by 100. For example, losing 5 of 100 clients in a month equals a 5% monthly churn rate.
What is considered a good churn rate business benchmark?
Most established B2B service businesses aim for an annual churn rate business benchmark under 10%, which translates to roughly 1% or less per month. Agencies and consultancies with strong onboarding often reach 5% to 8% annually.
Why does churn rate matter for service businesses?
Service businesses rely on recurring retainers, so every lost client directly reduces predictable revenue. Tracking churn early lets teams intervene before a relationship fails instead of reacting after the cancellation notice.
What causes a high churn rate in business?
Common causes include poor onboarding, inconsistent communication, unclear value delivery, and missed early warning signs like dropped meeting attendance. Many of these issues are preventable with structured check-ins and health scoring.
How is churn rate different from retention rate?
Churn rate measures the percentage of customers lost, while retention rate measures the percentage kept. The two figures always add up to 100%, so improving one automatically improves the other.
What is the difference between gross churn and net churn?
Gross churn measures total revenue lost from cancellations and downgrades, while net churn subtracts expansion revenue like upsells from that total. A business can have high gross churn but low net churn if existing clients are spending more.
Can a business have negative churn?
Yes, negative revenue churn happens when expansion revenue from existing clients, such as upsells, exceeds the revenue lost from cancellations. It is a strong sign of a healthy, growing client base.
How often should a business measure churn rate?
Most service businesses should review churn monthly at minimum, though daily or weekly monitoring through an automated dashboard catches at-risk clients faster. Quarterly reviews alone often miss early warning signals.
What is the difference between customer churn and revenue churn?
Customer churn counts the number of accounts lost, while revenue churn measures the dollar value lost. A business can lose a small client with little revenue impact or a large client that significantly hurts revenue churn.
How much does customer churn cost a business?
The cost varies by contract size, but losing a client means forfeiting all future recurring revenue from that account plus the original acquisition cost. Many businesses underestimate this because the loss is spread across future months rather than felt immediately.
What tools help track churn rate for a business?
CRM platforms, billing systems, and dedicated retention tools like ClientBloom can surface churn signals by combining engagement, billing, and communication data. Spreadsheets work for very small portfolios but struggle to scale past a handful of accounts.
How can agencies reduce churn rate quickly?
Agencies can reduce churn quickly by auditing their first 30 days of onboarding, scheduling proactive check-ins before renewal dates, and flagging accounts with declining engagement. Quick wins often come from fixing communication gaps rather than overhauling the entire service.
Does onboarding quality affect churn rate?
Onboarding quality strongly affects churn because clients form their impression of value in the first 30 to 90 days. Businesses with structured onboarding and milestone tracking typically see meaningfully lower early-stage churn.
What is a common mistake businesses make when tracking churn?
A common mistake is only reviewing churn after a cancellation happens rather than monitoring leading indicators like usage drop-off or missed meetings. Reactive tracking misses the window where intervention could have saved the account.
Key Takeaways on Managing Your Churn Rate Business
In summary, a churn rate business metric is one of the most reliable predictors of long-term revenue health for agencies, consultancies, and other recurring-revenue companies. Calculating it is straightforward, but acting on it consistently — through better onboarding, proactive check-ins, and clear benchmarks — is what actually separates businesses that retain clients from those that keep replacing them.
Ultimately, the businesses that manage their churn rate business metrics well treat them as a daily signal rather than a quarterly surprise, pairing gross and net churn tracking with customer lifetime value analysis and a structured reduction plan. For teams ready to put this into practice, exploring a resource like ClientBloom alongside the calculator and guides linked throughout this article is a reasonable next step toward keeping more of the revenue you have already earned.

